SSteeraMed

RootMap · Preprint in submission

Which maintenance states shape how our organs age?

RootMap maps conditional dependencies between aging hallmarks and organ-aging patterns, from blood DNA methylation.

Patterns in blood-based scores — not proof of biological control.

Preprint · in submission 2026

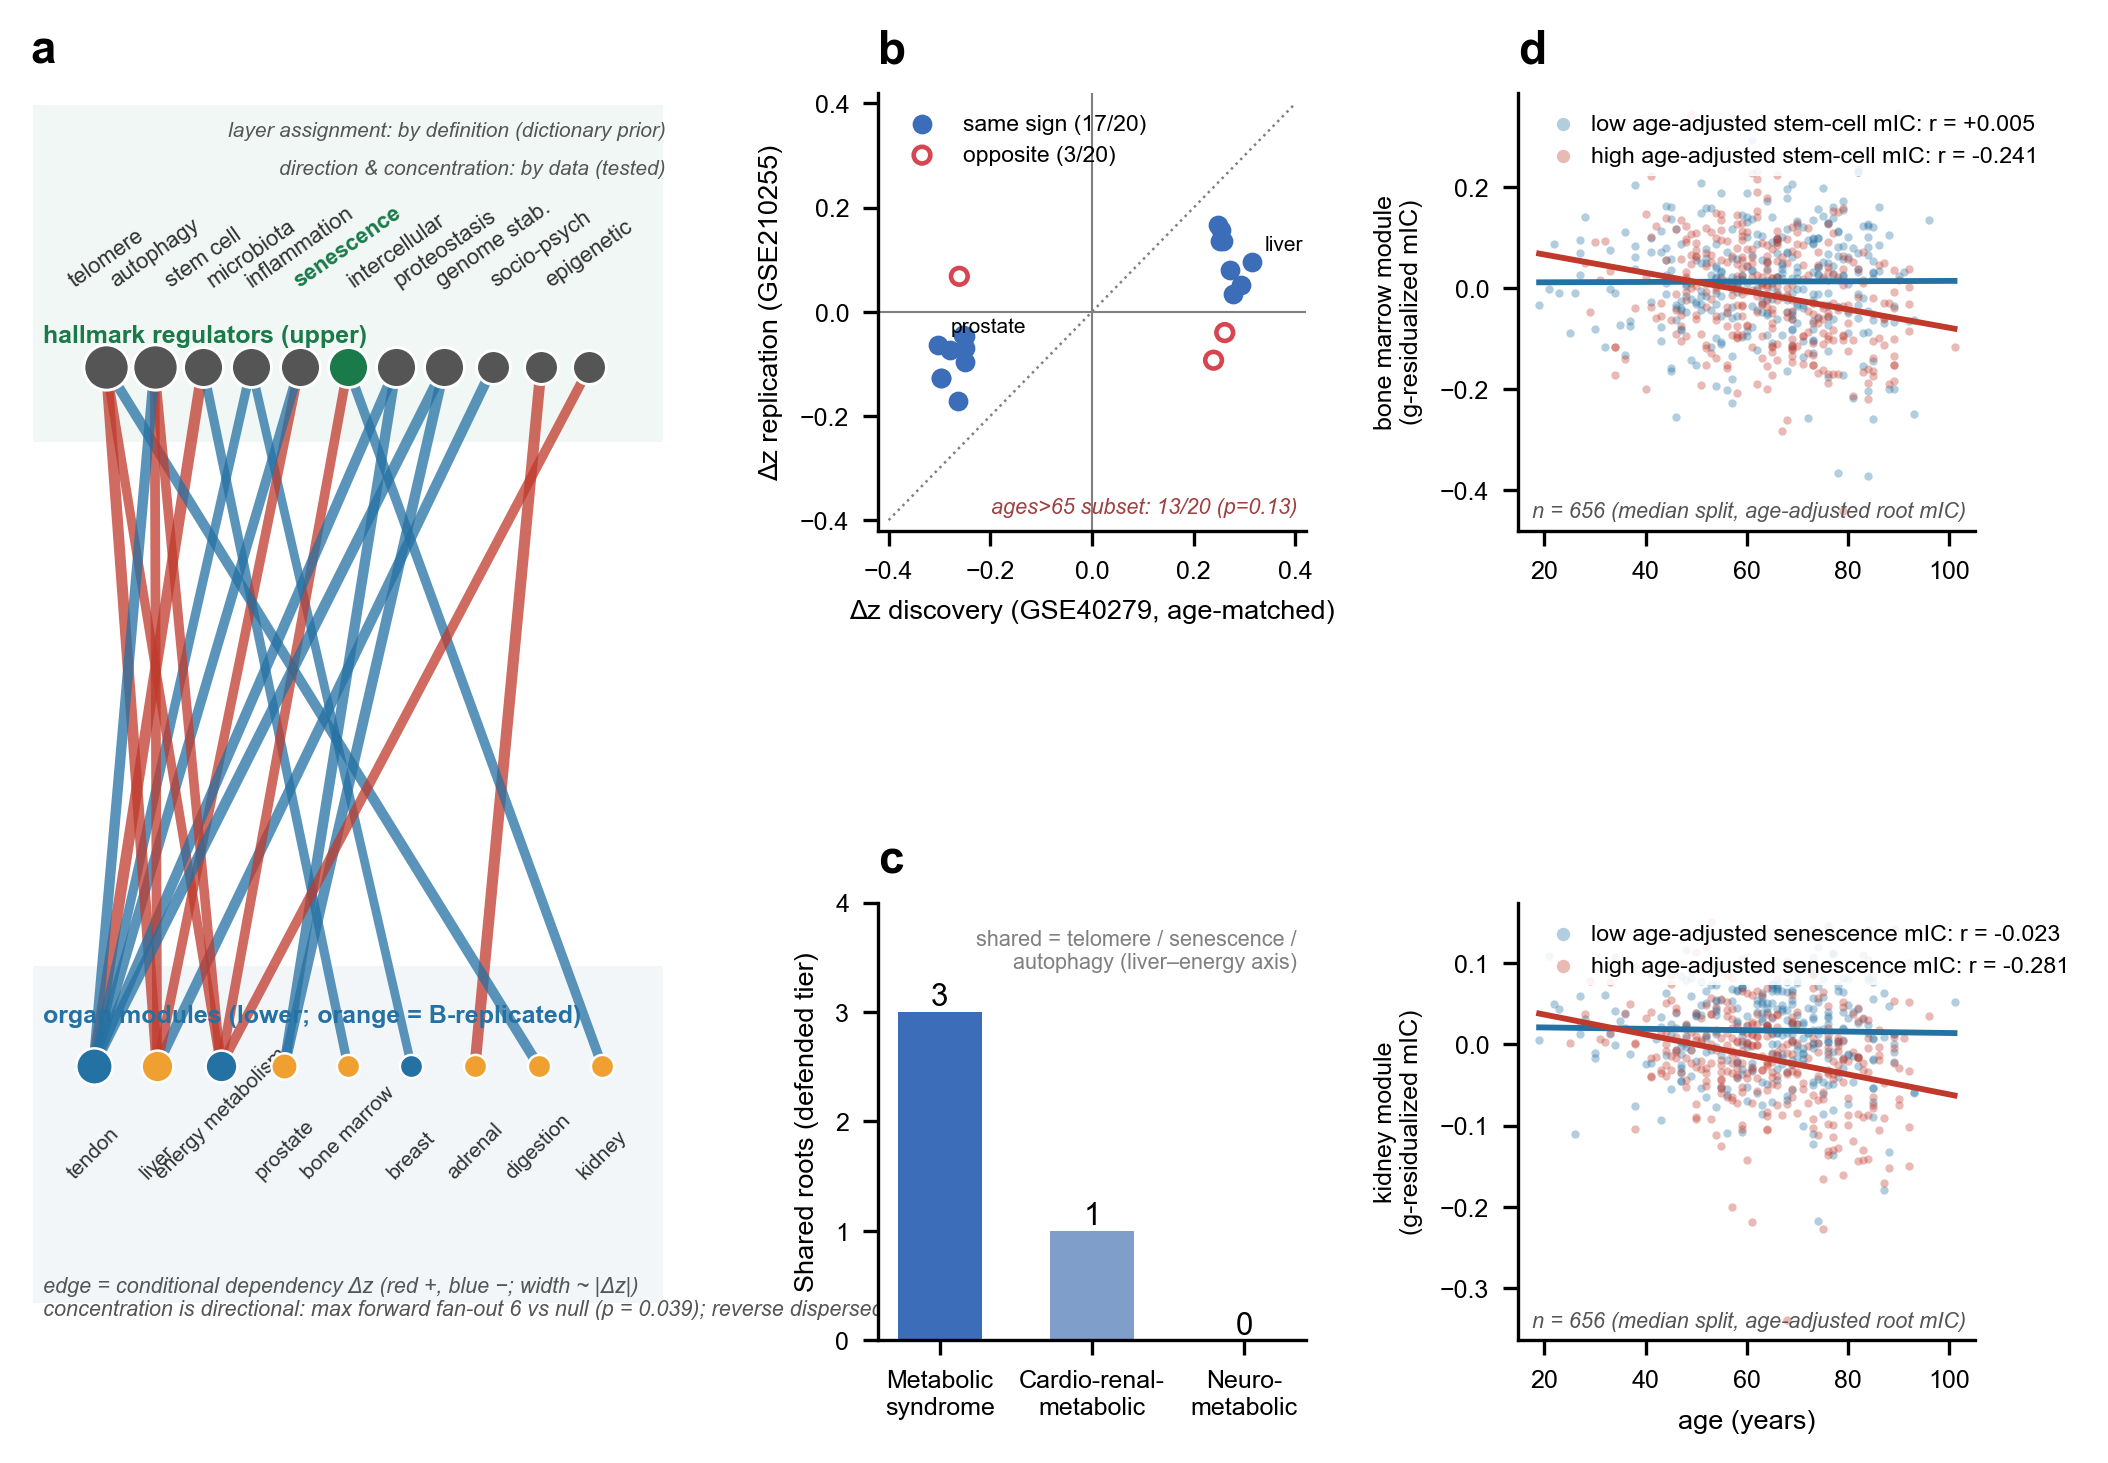
Fig. 2: the hallmark–organ dependency network and the bone-marrow worked example, with scatter plots by hallmark-score group.
Fig. 2 · Hallmark module scores are associated with organ–age patterns.

332

gene modules

656 + 1,394

two cohorts — discovery + replication

22

hallmark–organ pairs passed four checks

17/20

kept direction in the replication cohort

Why

A network of connections is not yet a map of dependencies

PPI networks stop at connectivity

Protein–protein interaction (PPI) networks show which molecules are connected. They do not, by themselves, show which maintenance processes sit upstream of particular organ functions.

Hallmark catalogues are lists, not relations

Aging-hallmark catalogues name processes shared across aging and age-related disease. They are used as a list of mechanisms — not as relationships between foundational processes and specific organ functions.

Practice still needs answers

Longevity medicine has to decide what to measure, which candidate targets to investigate, and what to follow up in longitudinal and N-of-1 studies.

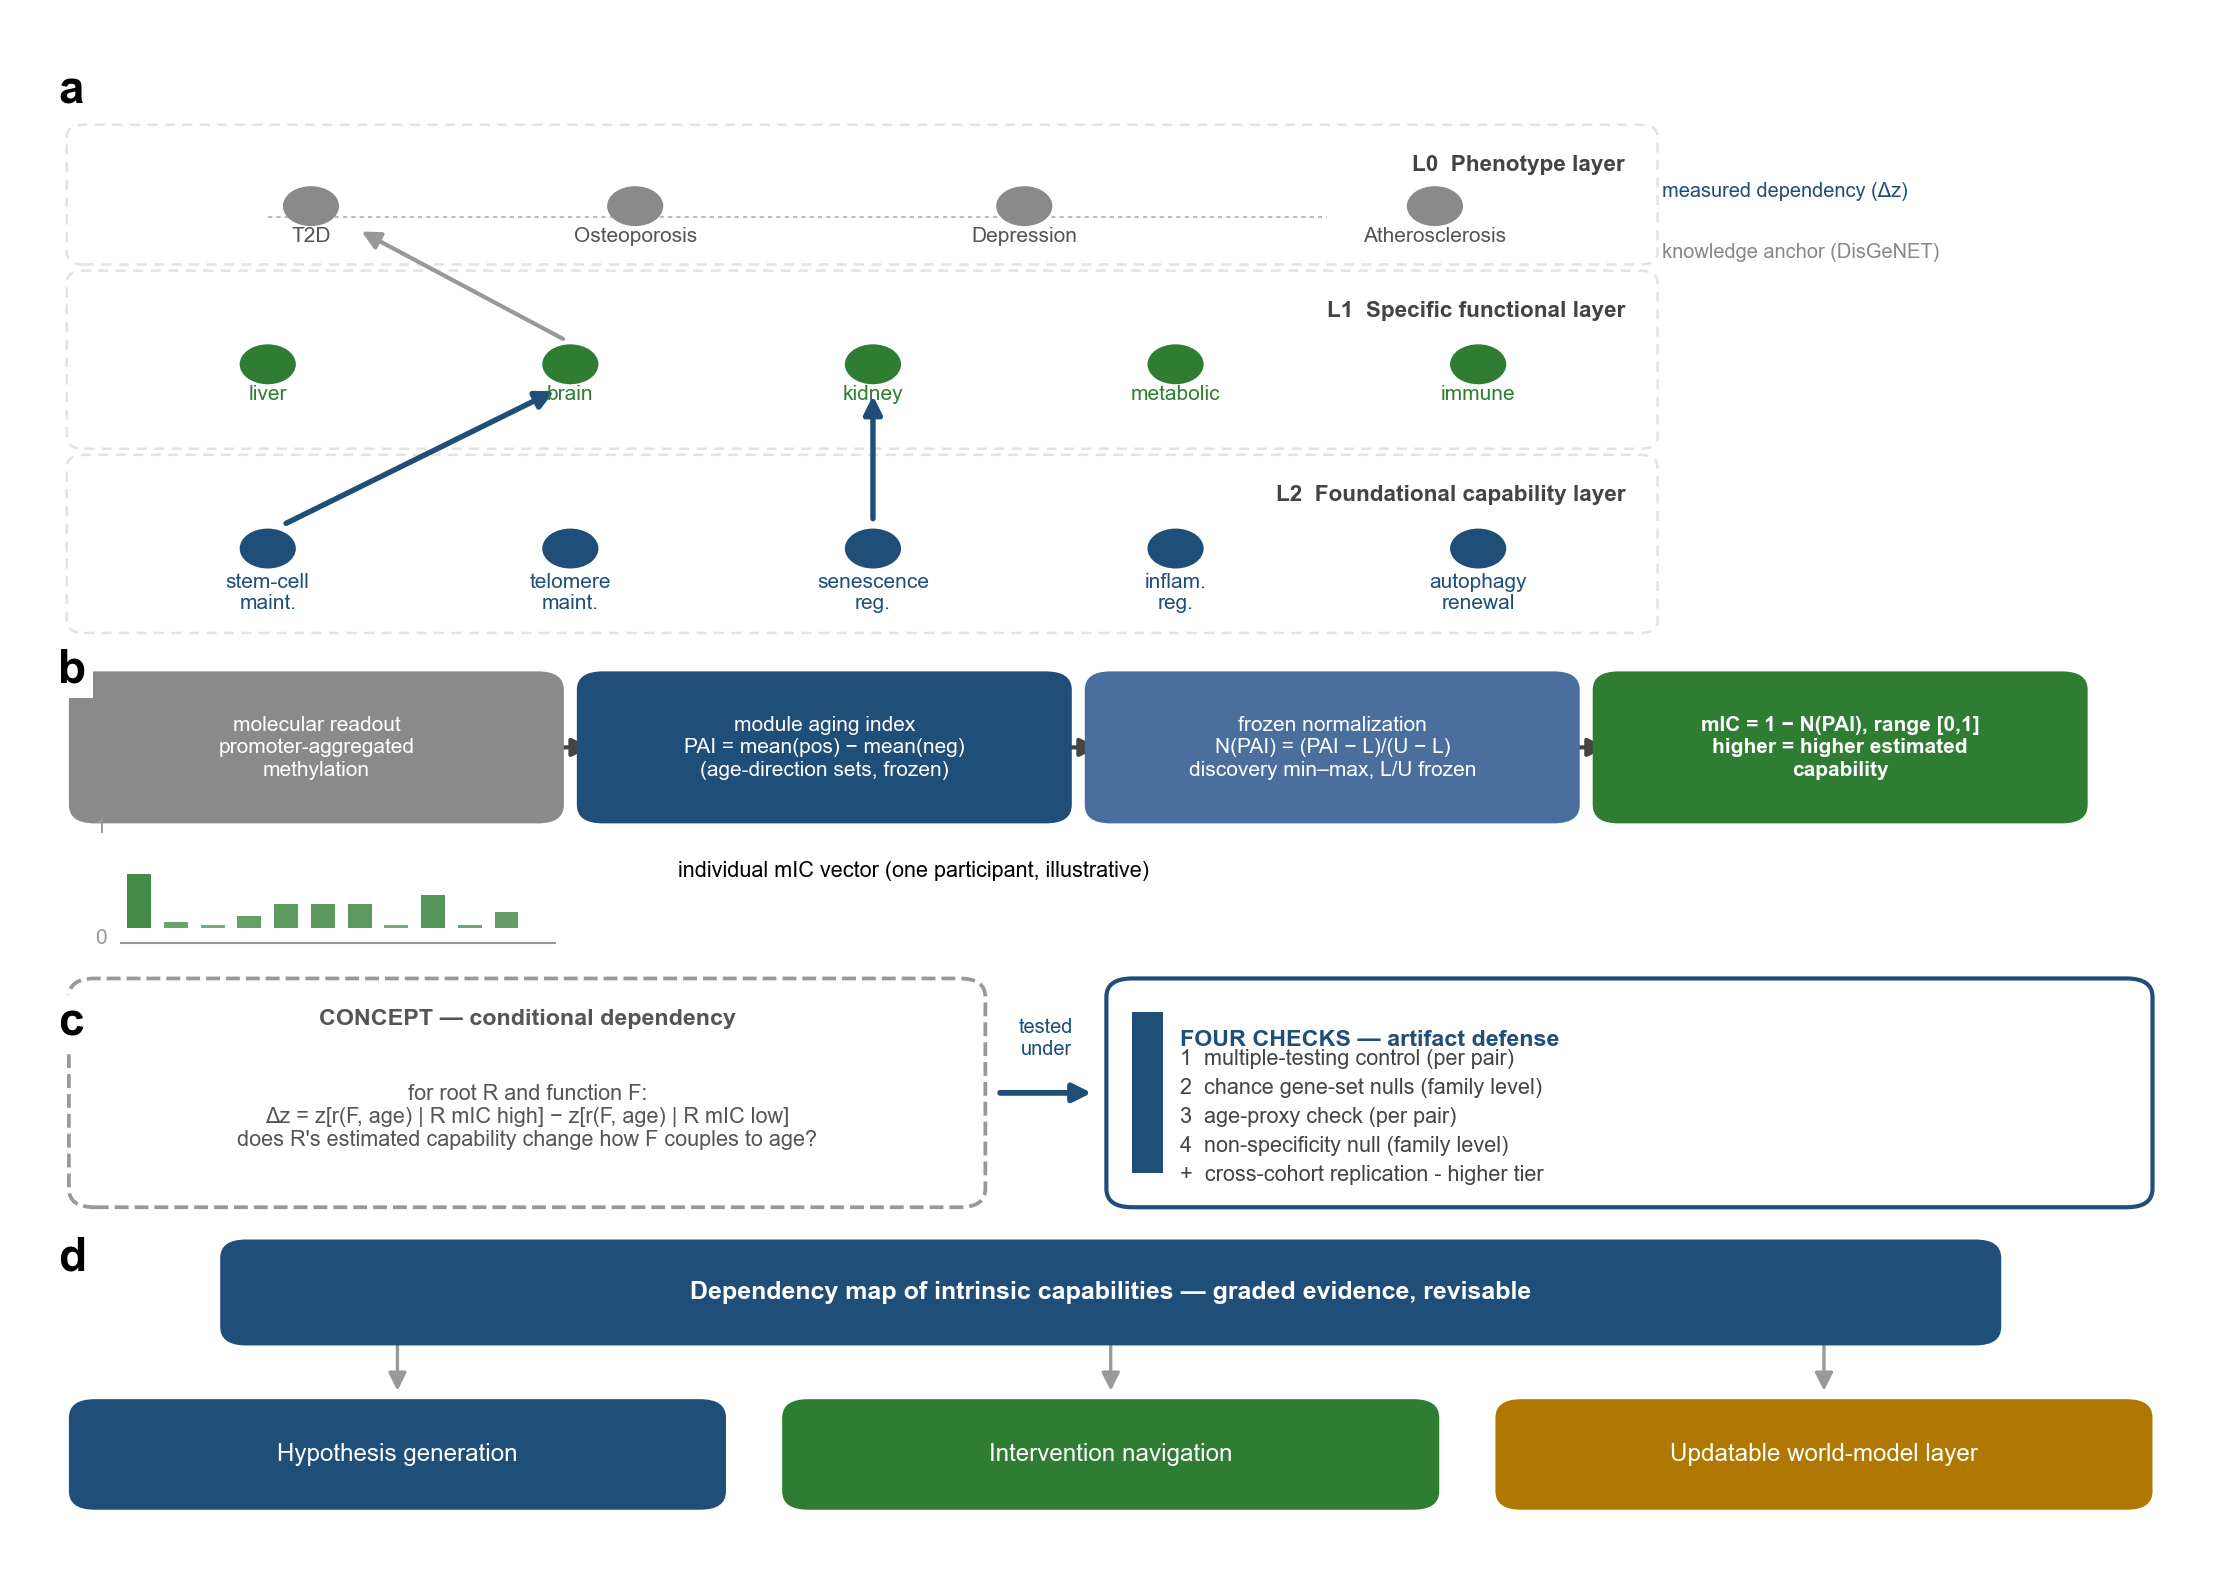
Fig. 1: the map spans three levels, from clinical phenotype to specific functions to foundational capabilities.
Fig. 1 · From clinical phenotype to function to foundational capability.

How

Three plain-language steps

mIC

mIC — a capability score for every module

Every gene module gets a score in every blood sample: one minus the normalized module aging index (mIC, module-level intrinsic capability), with bounds frozen in a reference cohort. A higher mIC means a higher estimated capability on that reference scale.

Δz

Δz — one number per dependency

Split participants into higher and lower age-adjusted hallmark-score groups, then compare the organ module's association with age between the two groups. A positive Δz means the association is more positive in the higher-score group; a negative Δz means it is more negative.

4 ×

Four checks — before any claim

Multiple-testing correction; random-direction null gene sets; an age-proxy check, so the split does not simply separate younger from older participants; and random gene-set controls. Cross-cohort replication is graded separately.

Evidence

Two tiers, checked four ways

Tier 1 — cross-cohort direction replication

  • 17 of 20 pairs on the replication list kept their direction in the second cohort
  • all 10 of 10 testable organ-line pairs agreed in direction
  • family-bootstrap 95% interval for the number agreeing: 13–18

Tier 2 — single-cohort dose shapes

Whether a relationship changes steadily across low, middle and high groups is reported as single-cohort evidence unless independently tested.

Every number on this page traces to the preprint (Tables S1–S2; Figs. 2–3) and is kept in a single facts file.

What we do NOT claim

Not proof of causation

A dependency is a measured difference in associations. It does not show that one module causes change in another.

Not a prediction of individual response

RootMap does not predict an individual's response to an intervention, and does not recommend one.

Not a substitute for controlled studies

These are observational patterns in blood-based scores. They do not replace controlled studies.

Findings

Four findings, with their numbers

Direction asymmetry

Hallmarks mark organ aging more than the reverse

Forward (hallmark → organ) links were more concentrated than reverse links: ΔC = +0.18, p = 0.030. Hallmark modules more often marked differences in organ–age associations than organs marked differences in hallmark–age associations.

ΔC = +0.18 · p = 0.030
Stem-cell maintenance × bone marrow

One comparison that shows what a dependency means

Among people with higher age-adjusted stem-cell-maintenance mIC, bone-marrow mIC was more negatively associated with age (r = −0.241); among those with lower mIC, the association was close to zero (r = +0.005). The same comparison for senescence mIC and kidney mIC: −0.281 versus −0.023.

bone marrow: −0.241 / +0.005 · kidney: −0.281 / −0.023

Carrier reversal

The most organ-specific sets carried the least signal

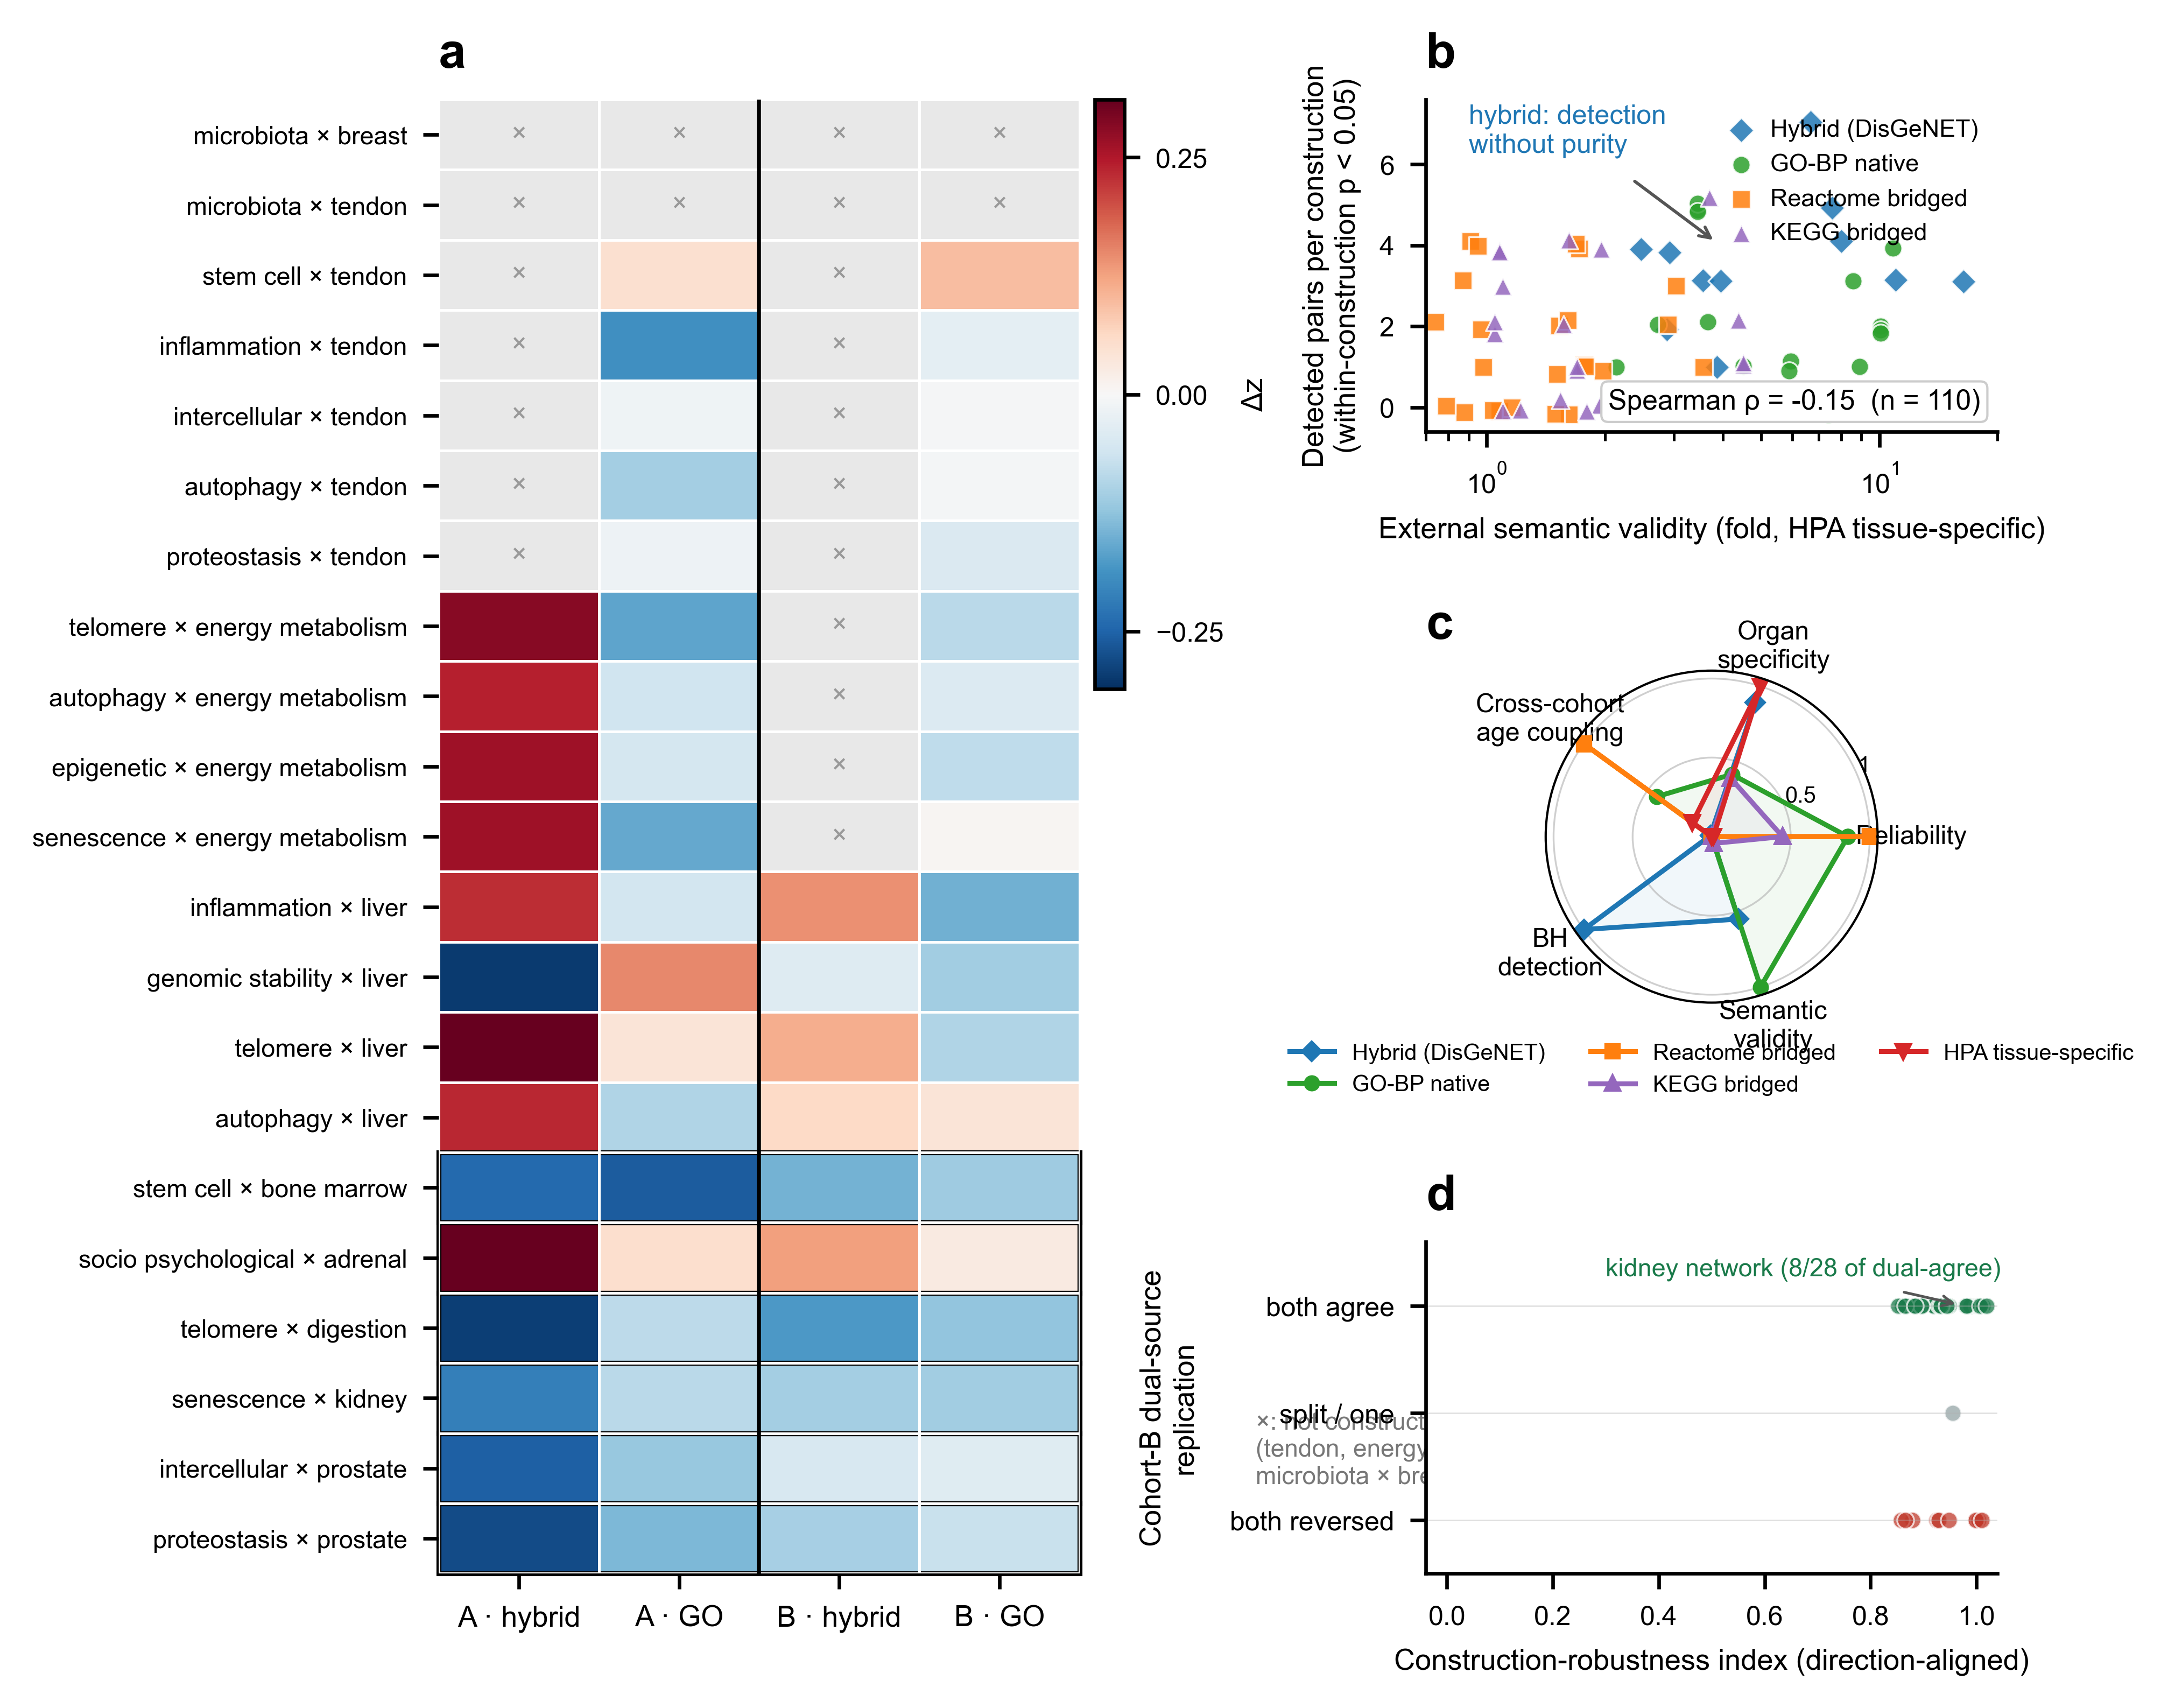
With Gene Ontology pathway sets, none of the 15 pairs that were significant with disease-anchored sets remained significant; PPI-expanded versions of the same sets recovered 8 of 11. In this blood-based analysis, the sets that looked most organ-specific carried the least detectable dependency signal.

GO sets: none of 15 survived · PPI-expanded: 8 of 11 recovered

Fig. 3: organ dependency pairs compared across gene-set definitions and cohorts.
Fig. 3 · Which organ gene sets reveal a measurable signal?

TCM in the same framework

A traditional concept need not map onto the same-named organ

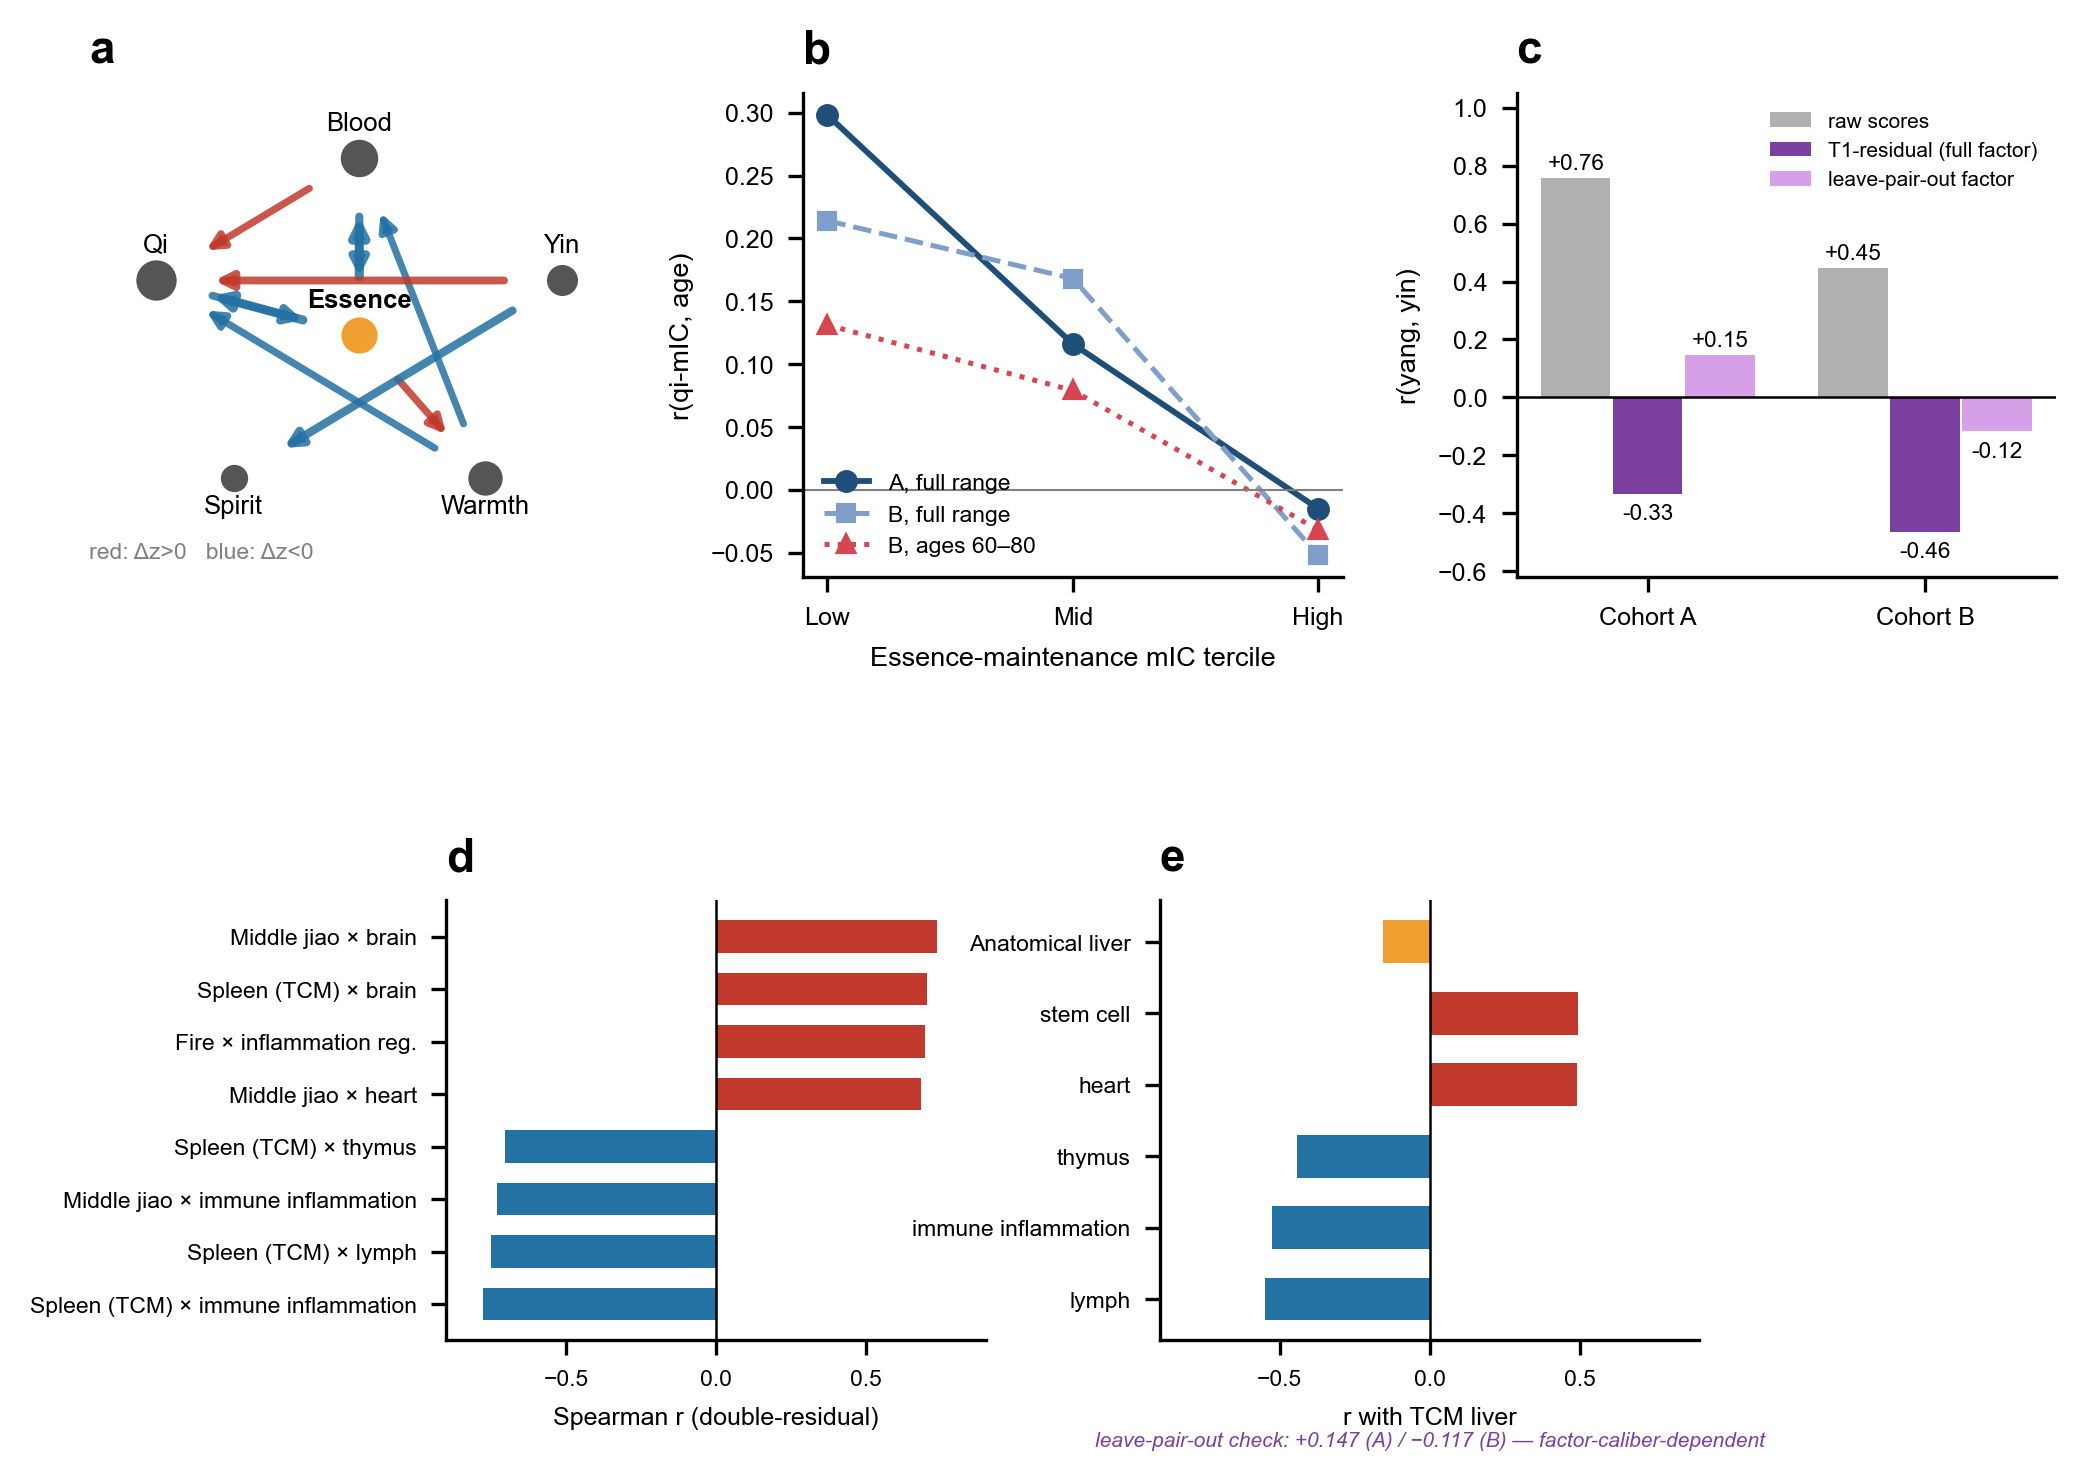
Essence was the largest hub among TCM fundamental substances, contributing 5 of 10 significant pairs. The TCM concept of liver corresponded more strongly to lymph and immune modules than to the anatomical liver (r = −0.15).

essence: 5 of 10 pairs · TCM liver r = −0.15

Fig. 4: relationships among TCM concepts and between TCM and modern modules.
Fig. 4 · Relationships within TCM concepts and between TCM and modern modules.

Measurable patterns in module scores, not validation of traditional theory.

For practice

Three questions from the clinic

What to measure?

A capability-state panel: mIC scores for the 14 foundational hallmark modules, plus organ, metabolic and immune modules — one frozen reference scale, every module scored the same way.

Which candidates to look up?

In a screening benchmark, filtering a PPI-ranked anti-aging candidate list by functional-layer labels made the list 2.8× more compact and raised hit enrichment from 3.19-fold to 8.87-fold (q = 0.033) — not distinguishable from draws matched for the number of drug targets (p = 0.18).

What to follow in N-of-1 studies?

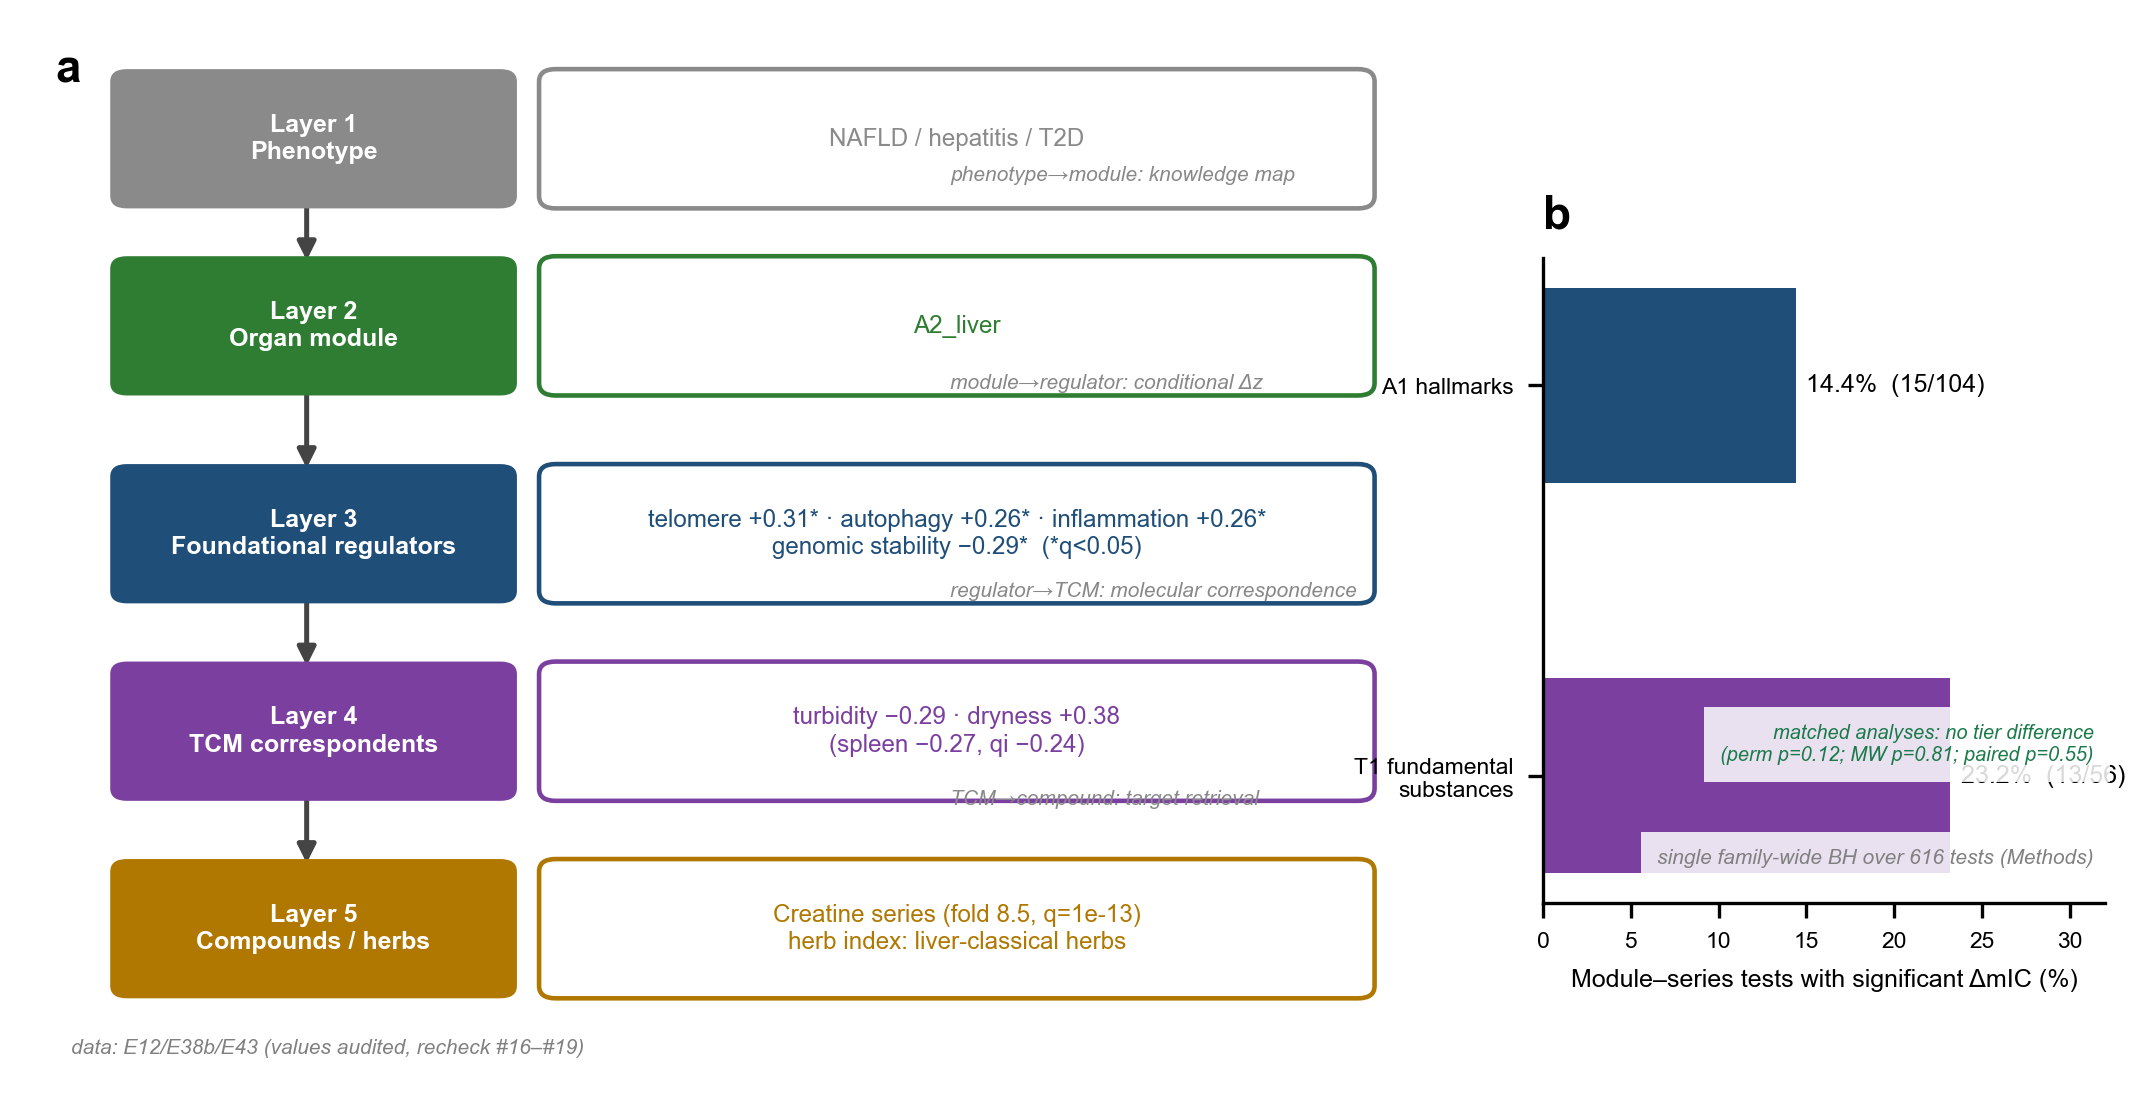
A navigation chain from a clinical problem: phenotype → organ module → hallmark regulators → related TCM concepts → compounds and herbs. These are candidate-retrieval links, not independent validation.

Fig. 5: a navigation chain from a clinical problem to organ module, hallmark regulators, TCM concepts, compounds and herbs.
Fig. 5 · Intervention-related score changes and a route from clinical problems to candidate interventions.

Candidate retrieval — not independent validation.

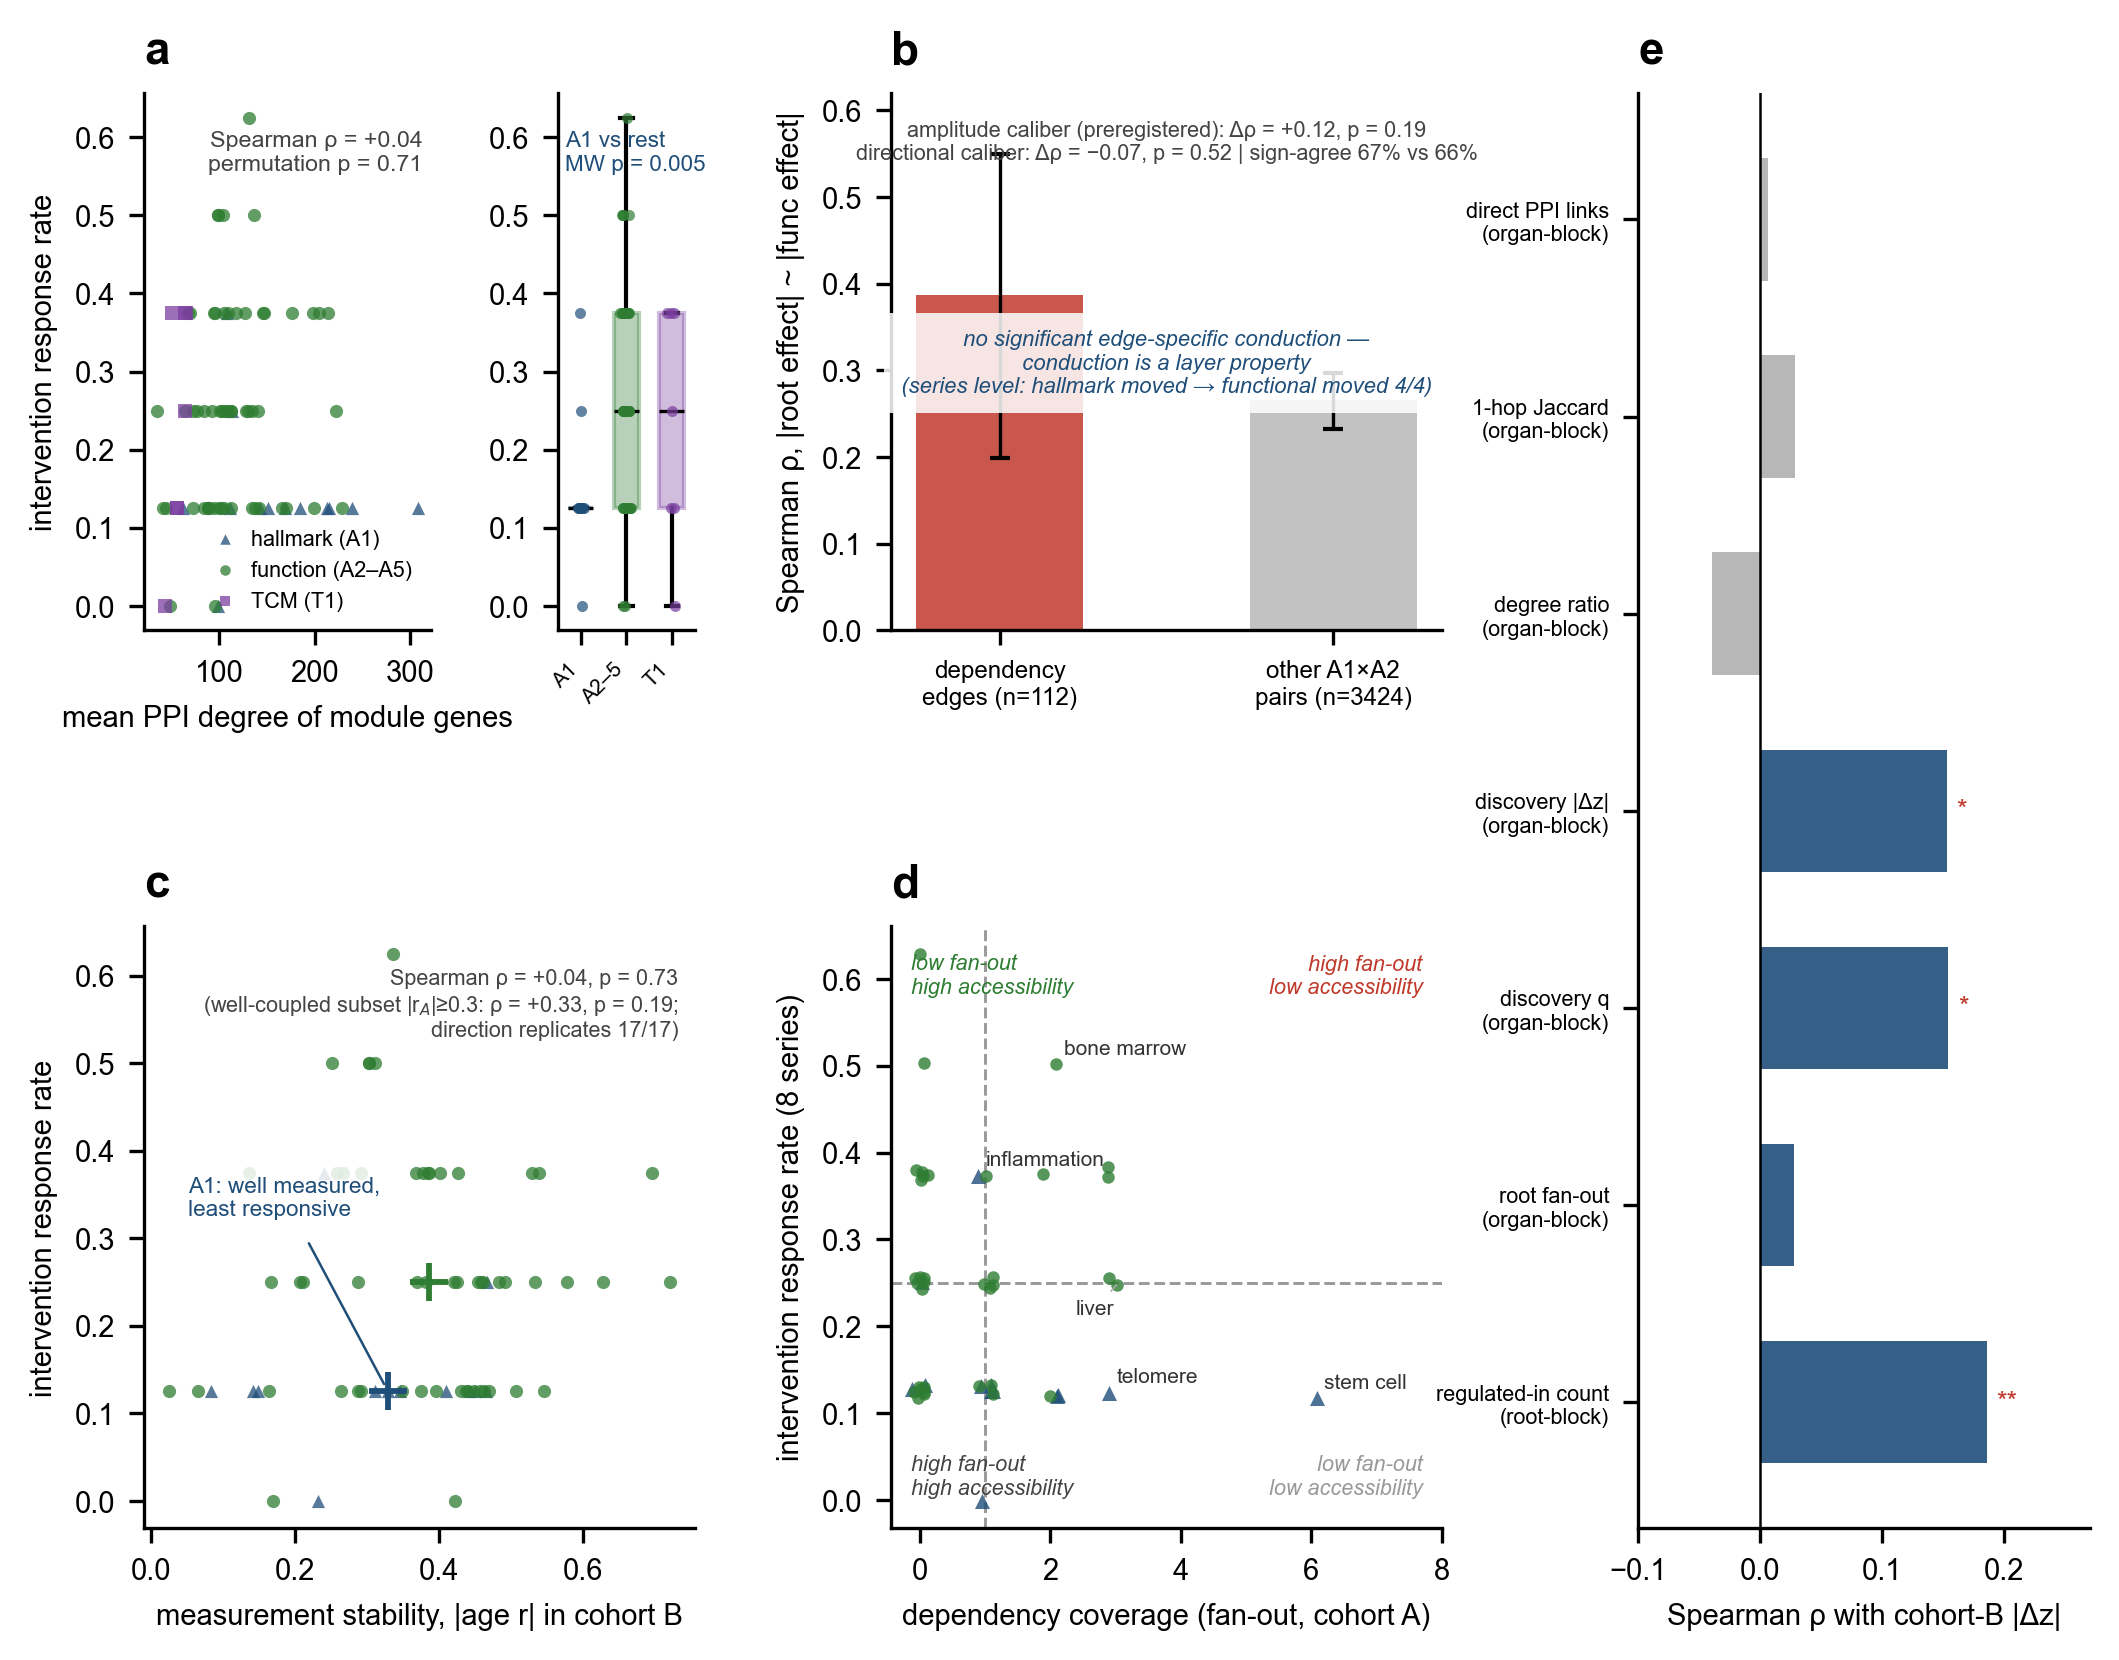
Fig. 6: module features versus intervention response and cross-cohort transfer.
Fig. 6 · Which module features relate to intervention response or cross-cohort transfer?

Across eight intervention series, functional modules changed more often than hallmark modules (25.4% versus 14.4% of tests; Fisher p = 0.020) — in the studied series, the functional layer was the one that moved more often.

Limits & roadmap

Read the map with these boundaries

Observational, not causal

A dependency here means an association differs across levels of another module; no causation is claimed.

Blood cell composition dominates

Module-level correlations with the broad cell-mixture signal reach |r| = 0.65–0.84. We correct for it, but blood is not organ tissue.

Gene-set definitions set the boundary

GO pathway sets lost the organ signal; PPI-expanded sets recovered it. Each organ claim must be read together with its gene-set construction.

Not yet established in older participants

Among participants older than 65, 13 of 20 pairs agreed in direction.

Absolute mIC awaits calibration

The frozen reference scale does not yet calibrate absolute values across platforms; we compare directions and ranks, not absolute levels.

Roadmap

  1. A third cohort and cross-modal readouts (protein clocks, imaging)

  2. Calibration studies for absolute mIC values

  3. An interactive RootMap tool, offered as a Research Preview through steeramed.com

Paper & access

The preprint behind this page

PreprintPreprint · in submission 2026

RootMap: A Longevity Medicine Framework for Mapping Conditional Dependencies Between Aging Hallmarks and Organ-Aging Patterns

Jianghui Xiong · DeepoMe Inc.

Abstract, first sentence

“Longevity medicine needs ways to identify a small number of candidate intervention targets that might affect several functions at once.”

Versioned data package

207 gene-set constructions, module scores, and per-pair statistics (r_high/r_low, Δz, q) underlying the figures — available from the corresponding author.

Work with us

Research collaboration and independent validation are welcome.

Boundary

Patterns in blood-based scores — not proof of biological control.